Software is key to any business process in the modern world. But software and applications rely on databases for data management, which is why databases are extremely important. As operations get complex, data load increases and makes it extremely important to watch for database performance. Any errors in the database can impact performance and lead to businesses losing out on time and money, sometimes even millions of dollars. This is why we need database monitoring.
What is Database monitoring?
But before we move any further, let’s ask ourselves this one question, “What exactly is database monitoring?”
Monitoring databases is the practice of monitoring and analyzing the performance of a database based on crucial metrics that influence it. The metrics are usually monitored in real-time, which allows you to detect or anticipate problems.
The goal of monitoring your database is to ensure that your database and the resources it is associated with operating at their highest quality, which will ensure that your application infrastructure remains operational and accessible. It allows IT administrators to perform fast and precise processes for solving problems which saves time and resources. Its main benefit is that users enjoy an easy, continuous experience where issues are resolved and quickly.
Database monitoring lets you identify any changes, pinpoint bottlenecks, and pinpoint the exact moment the problems began to develop. Once you have this information, you can determine the cause and find the root of the issue.
Why is database monitoring important?
Now that you understand what database monitoring is, let’s understand why database monitoring is important?
Databases are crucial to any system, and any problems in the database that go unignored will eventually cause problems in the system, thus affecting the overall performance. By analyzing the activity of users and applications, you get an accurate overview of your databases. Implementing a solid monitoring program for your database could yield significant advantages to your company. They include:
- Reduced time and energy spent in hunting for hidden problems in the IT infrastructure and database
- Improved end-user experiences
- Effective capacity planning
- Ability to diagnose performance issues regularly before they impact the user in the end
- Learn how and why performance can be enhanced
- Security flaws that could be a cause for concern.
How to perform database monitoring?
Database monitoring is a continuous process. You need to follow certain best practices to ensure that your database is configured for optimum performance. But at the same time, certain metrics need to be monitored regularly to check for any issues or errors. This is why we divide the process into two parts: Proactive and reactive.
A proactive approach is designed to find problems before they turn into problems, and a reactive strategy is designed to reduce the impact of these issues after they’ve occurred.
Reactive monitoring could be utilized to troubleshoot performance issues, major incident reports, or a cybersecurity breach inquiry.
Many people believe that taking a proactive approach is safer and can result in more user satisfaction. However, to remain proactive, you must ensure that you’re keeping track of the appropriate metrics and alerting the appropriate people whenever something is off or out of the norm. So, what are these metrics? Let’s have a look.
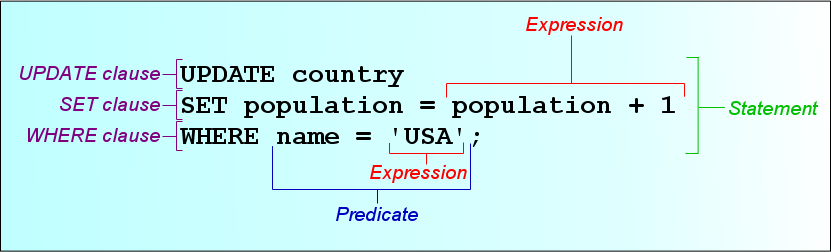
1. Query Execution
Queries are an important part of optimized database performances. To ensure the highest level of overall efficiency, you need to track the performance of queries. Monitoring your database will alert you about any queries that have issues, like poor joins between tables, excessive or insufficient indexes, and other SQL-related issues.
2. Hardware-related metrics

Databases rely highly on the hardware used and any changes or problems in the same. Hardware-related problems arise when there is a lack of memory, misconfiguration of the system, low processing power, and low disk space.
3. Concurrency issues
If you have many users accessing your database at once, it is possible to experience conflicts with queries or other tasks. Slow queries can cause page locking. Batch activities might cause resource contention. All of these issues could negatively affect how your databases perform. This becomes a key metric that needs to be constantly monitored.
Now that we understand the what, the why, and the how of database monitoring, we need to delve deeper into the database monitoring tools that are available in the market. All these tools are made to ensure the best practices are followed and keep a close eye on all major aspects that can impact the performance of the database.
There are a few popular tools, such as the SQL Server Management Studio (SSMS). The MySQL management studio, according to Microsoft, “is an integrated environment for managing any SQL infrastructure. Use SSMS to access, configure, manage, administer, and develop all components of SQL Server, Azure SQL Database, and Azure Synapse Analytics.” Today, we look at the top monitoring tools that make your job of monitoring databases easier.
Top 5 database monitoring tools
Let’s now examine some of the most industry-leading monitoring solutions in the market. This article is focusing purely on monitoring SQL databases and we will cover monitoring NoSQL databases such as MongoDB in another article.
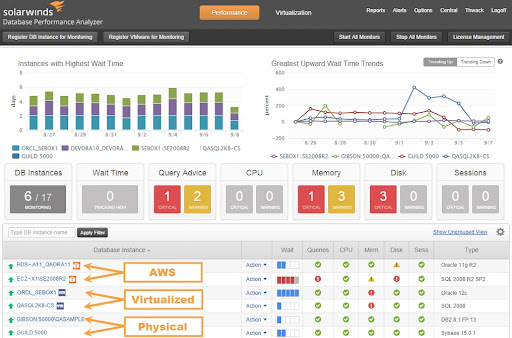
1. SolarWinds Database Performance Analyzer (DPA)
SolarWinds Database Performance Analyzer is the top choice as a monitoring solution. It’s a highly-rated tool for administrators of networks, and it’s not difficult to understand the reason. The ability to analyze root causes offers a significant advantage in the market, as the data visualization is highly interactive and user-friendly.
SolarWinds DPA is suitable to enable SQL Server audit, Oracle, IBM DB2, SAP ASE, and many other engines. It is a different method of monitoring the performance of databases that focuses on the time to respond and multidimensional analysis of performance. This approach is based on the fact that the most significant performance indicator is the time taken to respond to a database.
DPA is developed with a clever approach. It combines the Response Time Analysis in a multidimensional root cause analysis that analyzes and correlates SQL statements and system state of health, analytics-based upon wait and the context. They also send notifications for some of the critical events that may arise.
Its easy-to-use dashboard, real-time information, integration capabilities, and incredibly responsive response Time Analysis approach make SolarWinds DPA the most obvious choice to use as the top database monitoring tool. Some of the key features include:
- Real-time monitoring of session and analysis of performance for VMware
- Ability to drill down by object, program, database plan, etc.
- Historical trend dashboards, reports, charts, and alerts
- The ability to look back in time to find the root of past problems
- Support for Amazon RDS, Azure, AWS, PostgreSQL, and MySQL
2. SolarWinds SQL Sentry
SQL Sentry is a database performance monitor and is built to provide DBAs greater insight into the whole Microsoft information estate that arises from Microsoft SQL Server. With a quick overview of the most recent and historic events and performance information, SQL Sentry can show execution plan diagrams, queries history, availability, and much more, which allows you to identify the most problematic queries and correct them.
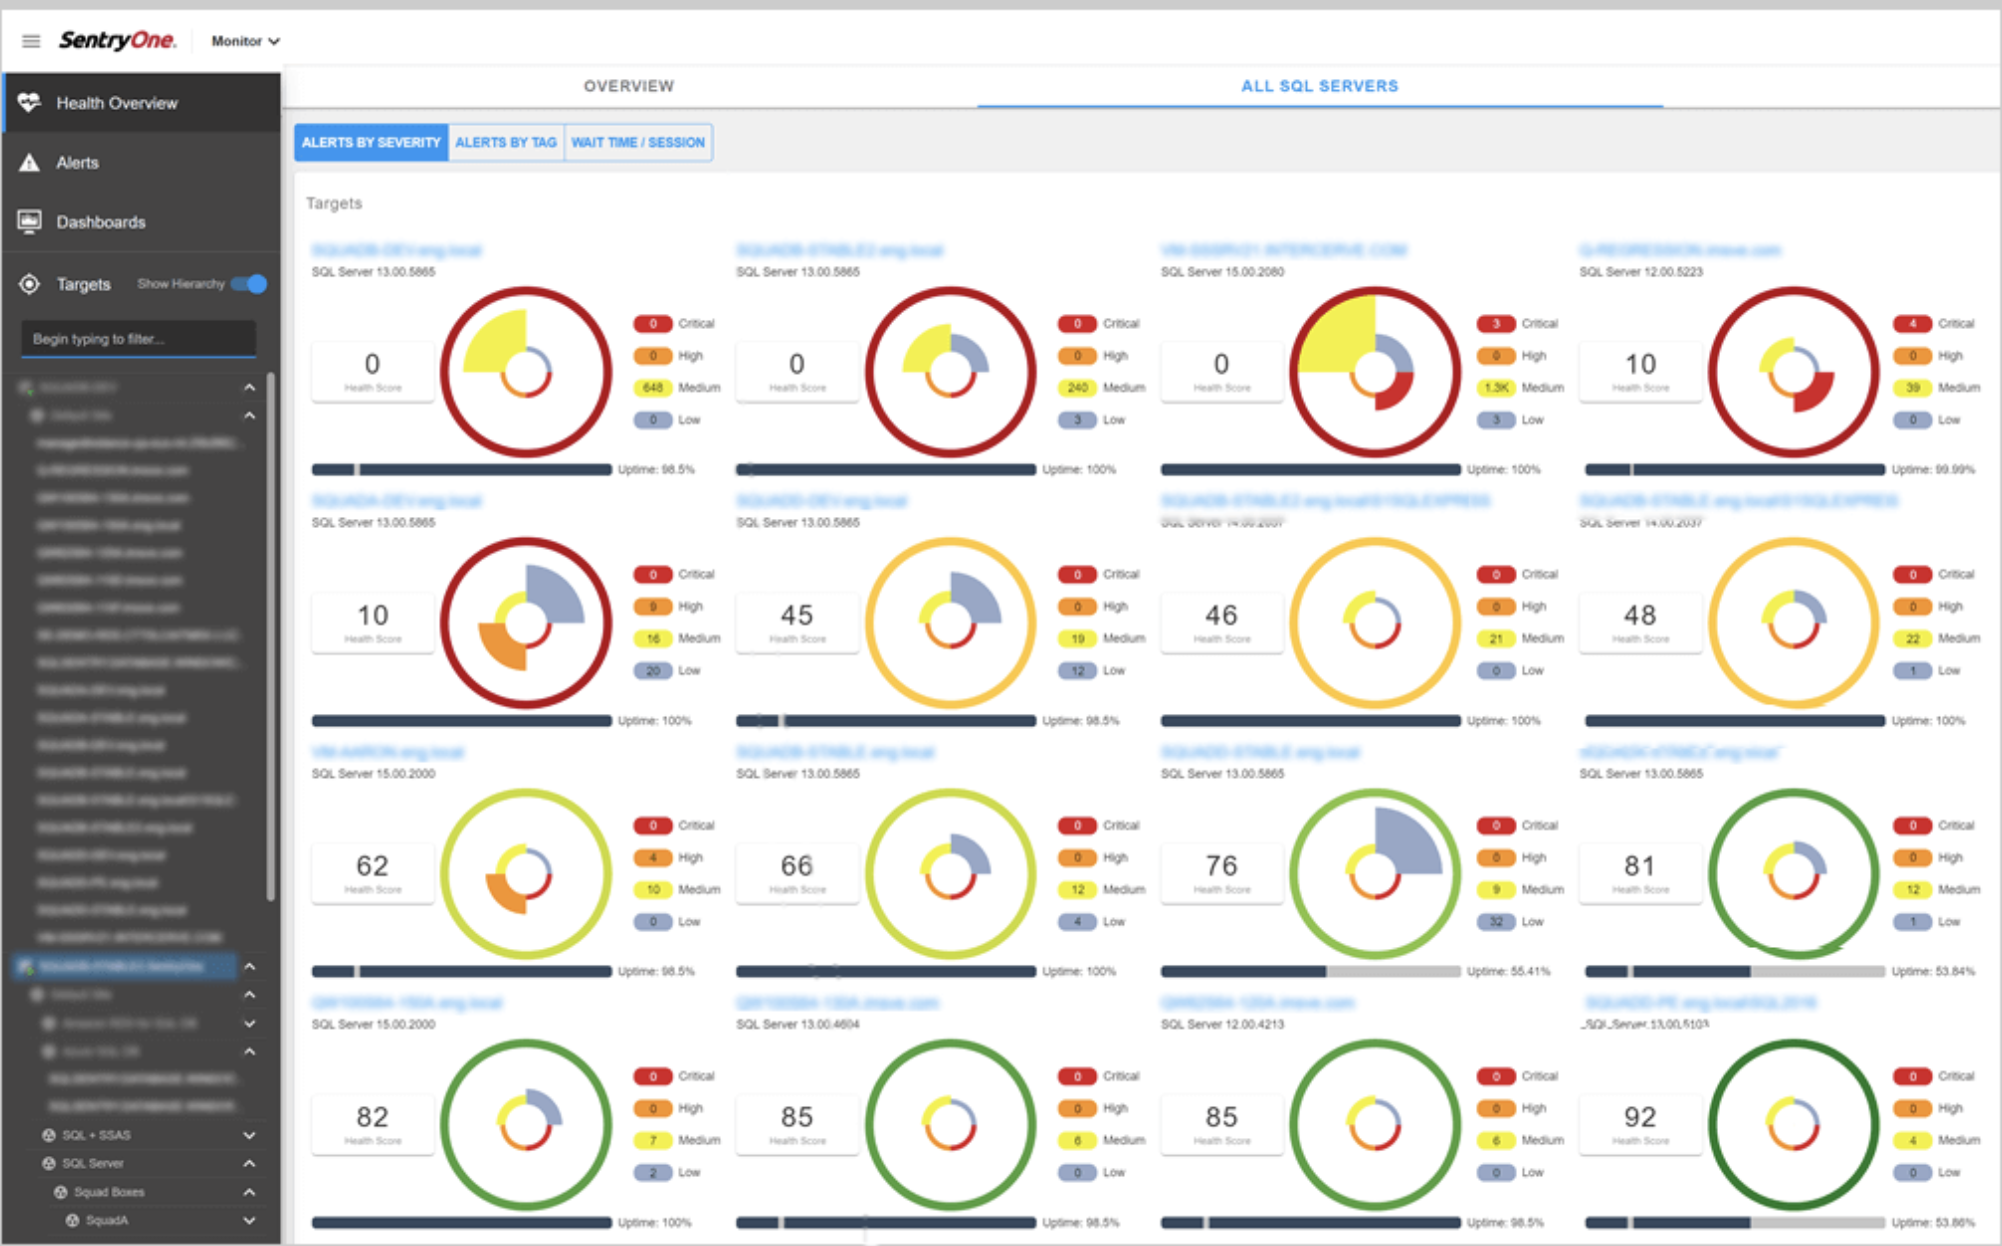
The capabilities for query analysis and SQL query performance in SQL Sentry are designed to surpass what you can get within SQL Server Management Studio (SSMS). SQL Sentry allows you to:
- Execute SQL Server audit in physical, virtual, or cloud environments
- Create relevant and actionable alerts and the capability to automate the response to certain conditions.
- Get a quick overview of the health of your environment.
3. SQL Power Tools
SQL Power Tools uses a non-impact monitoring approach for data that offers a range of powerful instruments. These include records of data from the IP address of the destination and the source application’s response time and the number of bytes and packets being sent. This is an easy tool that provides an accurate and trustworthy analysis of the overall efficiency of the database.
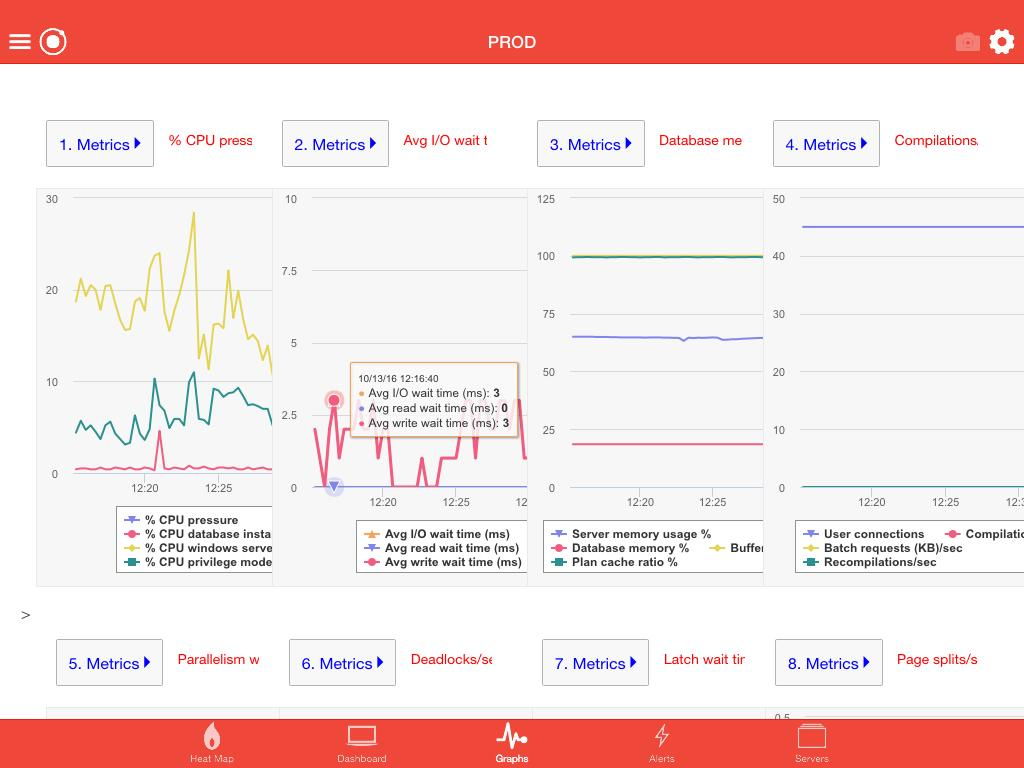
SQL Power Tools allows you to look at SQL wait time, SQL wait conditions, deadlocks blocking I/O time lags, disk utilization, SQL Agent Job Performance, and Index partitioning. The tool doesn’t use intrusive database SQL tracer or profilers. It costs 1% of overhead for databases that are monitored and use heat maps to display particular details.
Despite an impressive set of capabilities, SQL Power Tools doesn’t offer the same user-friendly experience that the top-ranked software on this list.
4. Redgate SQL Monitor
A web-based GUI tool, it displays all of your important indicators in one unifying dashboard. Additionally, each server is colored-coded, an easy way to gain insights into the overall health of your servers at a glance.
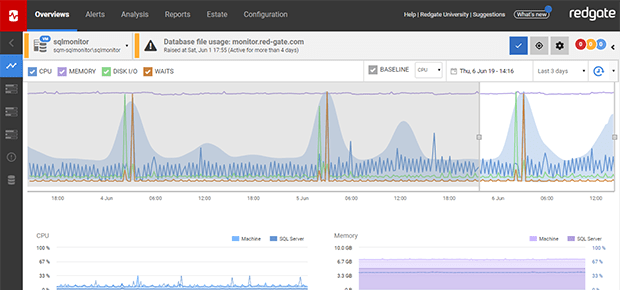
The tool also uses traffic lights that display green for health, amber for alert, and red for serious. The GUI is updated every 15 minutes, which means you can access the live stream of every action. The design features make it easier to manage the monitoring process by removing the noise and making it easier to understand your database.
Redgate also offers an alert system that can notify you of anything related to memory issues, excessive CPU or low disk space performance issues, as well as SQL errors. There are 40 alerts to choose from that are ready to use right from the beginning. These alerts can be customized through the use of the app, offering you the possibility of redefining parameters and thresholds to meet your requirements.
Redgate SQL Monitor offers monitoring tools that manage the complete SQL Server estate. It is also impressive that no matter if your servers are locally hosted or in Microsoft Azure or Amazon EC2 or even on Virtual machines, it is possible to monitor them all from the same place.
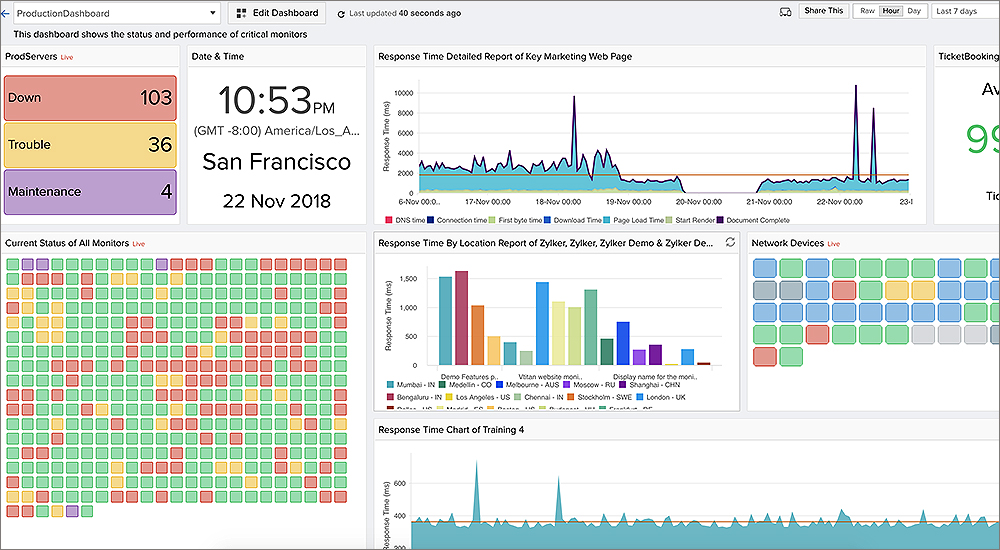
5. Site 24×7
There’s plenty to appreciate about Site24x7. This tool offers users optimal performance all day, every day of the year. What is remarkable is how it provides capacity planning by providing you with a greater understanding of buffer and memory manager info.
Site24x7 blends network, applications, and server monitoring to provide you an overview of your entire processes and operations, which aids in maintaining your database performance. It is cloud-based, meaning that you do not need to download any program. Therefore, it’s an ideal fit for MSPs as well as remote-site monitoring. Some administrators prefer that their systems do not be cloud-based due to an increased security risk. It supports many databases that include MariaDB as well.
The ability to customize alert parameters, detailed real-time performance metrics, and monitoring the performance of an unlimited number of applications are the reasons why Site 24×7 makes it to this list.
The pricing model is one of the most appealing features of the software that is subscription-based with optional add-ons, which make it possible to tailor the program to meet your needs.
Conclusion
As a decision-maker of the organization, you need to understand the entire process of monitoring. Additionally, knowledge of the execution process and some of the major tools will help you make decisions best for your enterprise. There is no one best database and that means that monitoring the databases cannot be avoided and you need to stay informed about the best industry practices. Despite this, if you still have any questions or queries, feel free to reach out to one of our professionals at OptimizDBA, and our experts will create a tailored solution that meets your performance goals.