

The Essence of Business Intelligence in Data Analytics
Understanding the Role of BI in Unearthing Insights
At the heart of business analytics lies the transformative power of Business Intelligence (BI). BI is instrumental in converting the deluge of raw data into meaningful insights, which are the cornerstone of strategic decision-making. By analyzing historical and current data, BI helps organizations understand their past performance and anticipate future trends.
Business Intelligence is not a static concept; it evolves with the market and technology. To stay ahead, businesses must address data challenges, upgrade technology, enhance privacy, and invest in skilled professionals. The analytics process is a journey from data collection to insight generation, ultimately leading to actionable strategies that drive business success.
- Key BI functions include:
- Data mining
- Reporting
- Performance metrics
- Descriptive analytics
The true essence of BI is its ability to make sense of complex data and provide a clear direction for the future. It's about finding the narrative in numbers and translating it into business value.
Historical vs. Predictive: The BI Continuum
Business Intelligence (BI) is a dynamic field that spans a continuum from historical analysis to predictive modeling. At one end, BI focuses on what has already happened, using data to understand past performance and inform present decisions. Organizations can leverage data-driven insights to enhance business intelligence with advanced analytics, differentiate BI and business analytics, and visualize BI processes for informed decision-making.
On the other end of the spectrum lies predictive analytics, a powerful BI tool that forecasts future trends and behaviors. By applying statistical modeling and machine learning algorithms, businesses can anticipate outcomes and strategically plan for what's ahead. This forward-looking approach is essential for maintaining a competitive edge in today's fast-paced market.
Predictive analysis is not just about forecasting; it's about empowering decision-makers with the knowledge to act proactively. The table below contrasts the key aspects of historical and predictive BI:
| Aspect | Historical BI | Predictive BI |
|---|---|---|
| Focus | Past performance | Future trends and behaviors |
| Data Utilization | Descriptive analytics | Predictive modeling |
| Decision Influence | Reactive decision-making | Proactive strategy development |
| Competitive Edge | Understanding market position | Anticipating market changes |
By integrating both historical and predictive analytics, businesses can create a comprehensive BI strategy that not only reflects on past achievements but also paves the way for future success.
Key BI Tools and Technologies for Data Transformation
In the realm of Business Intelligence (BI), a plethora of tools and technologies stand at the ready to transform raw data into actionable insights. The ability to navigate these tools is paramount for any organization aiming to leverage their data effectively. BI tools can perform a variety of functions, from data mining to predictive analytics, each playing a crucial role in the data transformation process.
- Data Integration Tools: Essential for merging data from diverse sources, ensuring consistency and reliability.
- Data Warehousing Solutions: Provide a centralized repository for organized data storage and retrieval.
- Analytics and Reporting Software: Enable the identification of patterns and trends through advanced statistical analysis.
- Data Visualization Platforms: Assist in translating complex data sets into understandable visual representations.
- Predictive Modeling Applications: Forecast future trends, aiding in strategic decision-making.
The selection of BI tools should be aligned with the organization's existing systems to ensure seamless integration and a holistic view of data. This strategic alignment is critical for enhancing the overall effectiveness of BI initiatives.
As the landscape of BI tools continues to evolve, staying abreast of the latest technologies and understanding their application within your business context is essential for maintaining a competitive edge.
Navigating the Data Analytics Process
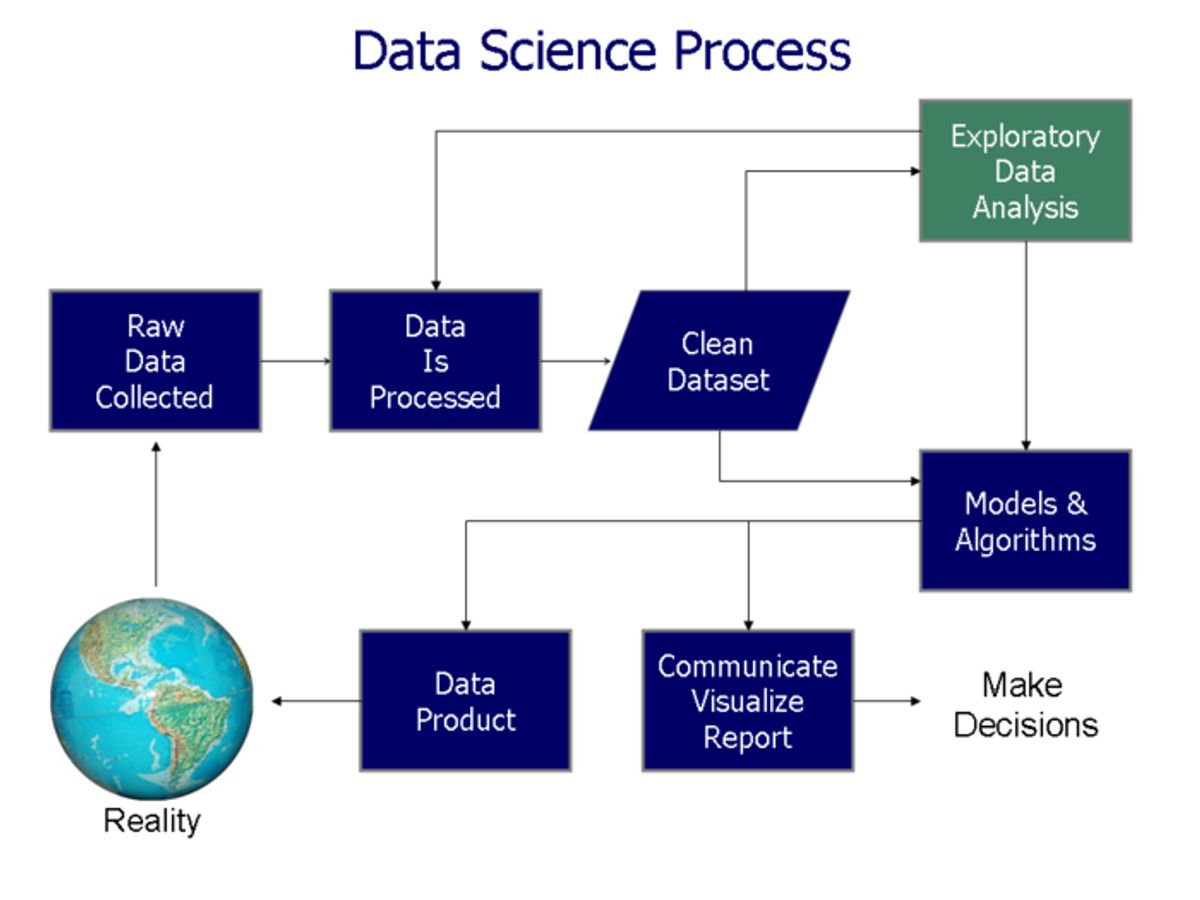
From Data Collection to Insight Generation
The journey from data collection to insight generation is a critical path in the realm of business analytics. It begins with understanding the business requirements; knowing what data to collect and how it will be used is essential for aligning with organizational goals.
Once the data is collected, the next step is data cleaning. This phase is crucial as it ensures the accuracy and reliability of the data, which is foundational for generating meaningful insights. Here's a simplified view of the process:
- Data Collection
- Data Cleaning
- Data Analysis
- Insight Generation
The ultimate goal is to unlock hidden data potential for informed choices and innovation.
Utilizing storytelling and analytics, businesses can transform raw data into narratives that drive impactful decisions and growth. This transformation is not just about processing numbers; it's about crafting a story that resonates with stakeholders and provides a clear direction for strategic action.
Overcoming Common Challenges in Data Analysis
In the journey of transforming raw data into actionable insights, analysts often encounter a myriad of challenges. Data governance is a critical aspect that ensures the accuracy and consistency of data across the organization. Without it, businesses risk making decisions based on faulty information.
Data quality is another common hurdle. It is essential to address missing values and outliers to maintain the integrity of the analysis. This is where best practices for Exploratory Data Analysis (EDA) come into play:
- Set Clear Objectives: Understand your analysis goals.
- Know Your Data: Familiarize yourself with the dataset.
- Address Missing Values and Outliers: Ensure data quality.
Building a data-driven culture is not without its challenges. It requires a focus on clear objectives, balancing data and intuition, and overcoming resistance to change.
Lastly, the human element cannot be overlooked. A successful analytics process involves collaboration with domain experts and continuous learning. As data analytics is crucial for customer-centric businesses, nurturing talent and fostering a culture that values data-driven decision-making is imperative.
Ensuring Data Quality and Integrity
The quality of data significantly influences the effectiveness of BI. When data is accurate, consistent, and relevant, it provides the foundation for reliable insights. On the other hand, low-quality data can lead to misleading outputs that could negatively impact strategic decisions. Hence, it's critical to invest in processes and tools that maintain high data quality, such as data cleansing techniques and regular data audits. This focus on data quality will ensure that the insights derived from BI are reliable and valuable.
Before diving deeper, we must clean our data. This means fixing or removing errors and filling in missing values. Consistency is crucial. We make sure all data is in the right format. For example, dates should look the same throughout our dataset.
Failing to verify assumptions can be a significant pitfall in data analysis. Assumptions can mislead, acting like guesses without all the clues. It is essential to test your guesses and use methods to check assumptions against your data, keeping the analysis grounded in reality. Inadequate data cleaning is another challenge; skipping cleanup is akin to trying to see through a fogged lens. Proper cleaning makes data reliable and is a must for accurate insights.
- Data Cleaning
- Data Exploration
- Data Analysis
These steps are part of a broader process that ensures data quality and integrity, reducing complexity and making sure that the collected data is efficient for analysis.
The Power of Data Visualization in Storytelling

Crafting Visual Stories from Complex Data
In the realm of business analytics, visual storytelling is not just about presenting data; it's about conveying the narrative hidden within the numbers. By transforming complex datasets into compelling visual narratives, we enable stakeholders to grasp intricate insights at a glance. The art of visual storytelling involves more than just aesthetics; it requires a deep understanding of the data and the audience.
Seeing is Understanding: Visuals make complex data simple. They reveal what numbers hide, allowing us to uncover data gold mines and communicate insights more effectively. A mix of charts, graphs, and diagrams can serve as powerful tools to illustrate trends, patterns, and relationships that might otherwise remain obscured.
Consistency in data visualization is crucial. Ensuring that all visual elements conform to a uniform style and format aids in maintaining clarity and coherence throughout the narrative.
While it's tempting to rely on a single type of visualization, this approach can be limiting. Just as a musician explores various genres, a data analyst should employ a diverse array of visual forms. Each chart, plot, and map contributes a unique perspective to the overall story, enriching the insights conveyed.
Here are some best practices for crafting visual stories:
- Clean and prepare your data to ensure accuracy and reliability.
- Choose the right mix of visualization tools to represent different aspects of the data.
- Maintain consistency in style and format to support clear communication.
- Use interactive visualizations to engage the audience and encourage exploration of the data.
Best Practices for Effective Data Visualization
Data visualization is a powerful tool for communicating complex data. By representing data graphically, intricate trends and patterns can be easily understood, even by those who aren't data experts. Leverage visual analytics to communicate insights, using dashboards, graphs, or charts to convey information. This practice not only makes it easier for decision-makers to grasp the insights but also fosters a culture where data is accessible, understandable, and central to strategic discussions.
Data charting is a scientific art form, with best practices evolving as technology improves. Professionals should stay on top of the latest trends in data analysis to ensure relevance and maintain their competitive edge.
Developing advanced data charting skills requires professionals to have a willingness to experiment. Testing data visualization tools can lead to better charts. Better visuals enhance your current presentations and provide more compelling storytelling.
When reviewing a data visualization, consider these tips to glean actionable insights:
- Analyze axes to understand the categories, values, and measurement interval
- Identify patterns like clusters or consistent changes in the data
- Consider what factors may have influenced the data
- Determine if the creator is authoritative and non-biased
Remember, effective data visualization is not just about presenting data; it's about presenting it in a way that is both engaging and insightful. It's the bridge between raw data and strategic decision-making.
Leveraging Tools like Tableau for Enhanced Insights
Tableau stands out as a powerful tool to deliver impactful data insights. By transforming data into insightful visuals, it drives strategic business decisions. Mastering Tableau's functionalities is crucial for anyone looking to excel in the field of business analytics.
Enhance your analytical prowess by participating in data challenges or hackathons, which can provide a public platform for your problem-solving abilities and innovative use of Tableau's features.
Tableau Analysts today must extend their expertise beyond mere data visualization. Proficiency in advanced analytics, such as predictive modeling and machine learning integration, is increasingly vital. A strong grasp of SQL and experience with data prep tools enhance data manipulation capabilities. Familiarity with Python or R for more sophisticated analyses is also beneficial. Additionally, soft skills like storytelling with data and effective communication are essential to translate complex insights into understandable and actionable information.
To get started with Tableau:
- Open web authoring or the desktop app to create a viz.
- Connect to a data source.
- Drag and drop dimensions and measures to explore the data.
- Once you've created your visualization, you're getting ready to publish your first data-driven story.
Advanced Analytics Techniques for Strategic Decisions
Predictive Modeling and Its Impact on Business
Predictive modeling stands at the forefront of business analytics, transforming historical data into a crystal ball of sorts. By leveraging statistical models and machine learning algorithms, businesses can sift through vast amounts of past information to uncover patterns that forecast future outcomes. This predictive power enables companies to make proactive, informed decisions.
Predictive analytics is not just about forecasting; it's about creating a strategic advantage by anticipating market trends and customer needs before they become apparent.
The integration of predictive analytics into business operations has led to significant improvements in decision-making and operational efficiencies. For instance, regression algorithms and neural networks have been instrumental in refining sales forecasts, leading to better inventory management and marketing strategies. Here's how predictive modeling impacts various business aspects:
- Sales: Accurate predictions of sales volume allow for optimized production and supply chain management.
- Marketing: Understanding future customer behavior helps tailor marketing campaigns to increase effectiveness.
- Risk Management: Identifying potential challenges early on aids in developing mitigation strategies.
Emerging trends in predictive analytics continue to shape the business landscape, with AI playing a pivotal role in enhancing the accuracy and applicability of predictions.
The Role of Artificial Intelligence in Data Analytics
The advent of Artificial Intelligence (AI) has revolutionized the field of data analytics, offering unprecedented accuracy and efficiency in decision-making. AI's ability to process vast amounts of data at high speeds allows businesses to uncover insights that were previously inaccessible.
- AI technology has many advantages over traditional methods in data analysis.
- It speeds up processes, reduces costs, and improves decision-making precision.
AI not only enhances existing analytics capabilities but also enables the creation of sophisticated predictive models that can forecast future trends and behaviors with remarkable precision.
The integration of AI into data analytics has also led to the development of intelligent systems that can learn from data, adapt to new scenarios, and perform complex tasks with minimal human intervention. This has been particularly transformative in industries such as healthcare, retail, and manufacturing, where AI-driven analytics have improved revenues and decreased costs.
Incorporating Prescriptive Analytics into Business Strategy
Prescriptive analytics represents the pinnacle of the data analytics evolution, where the focus shifts from what has happened, or what might happen, to what should be done about it. By leveraging the power of both descriptive and predictive analytics, businesses can not only anticipate future scenarios but also receive guidance on the best course of action to take.
Prescriptive analytics is about making data-driven decisions that can transform business outcomes. It involves the application of mathematical and computational sciences to recommend decisions optimized for specific objectives or constraints. Here's a succinct breakdown of the prescriptive analytics process:
- Data Collection: Gather relevant data from various sources.
- Data Processing: Cleanse and structure the data for analysis.
- Predictive Analysis: Use statistical models to forecast outcomes.
- Decision Optimization: Apply algorithms to determine the best actions.
- Action Implementation: Execute the recommended decisions.
- Results Monitoring: Track the outcomes to refine future recommendations.
By integrating prescriptive analytics into their strategic planning, organizations can simulate various scenarios and identify the most effective course of action, optimizing decision-making processes and driving business success.
The implementation of prescriptive analytics requires a blend of business acumen and technical expertise. It is crucial for organizations to have the right tools and a skilled team capable of interpreting complex data and turning it into actionable insights.
The Strategic Role of a Business Intelligence Manager
Bridging the Gap Between Data and Decision-Making
In the realm of business intelligence (BI), the ultimate goal is to empower decision-making with actionable insights. A Business Intelligence Manager plays a pivotal role in this process, transforming raw data into strategic knowledge. By mastering BI tools, they provide the organization with a competitive edge, enhancing efficiency and strategic insights.
Data-driven insights are crucial for making informed decisions. They allow for a comprehensive understanding of patterns and trends within the business, leading to more effective decision-making at the organizational level. To achieve this, it's essential to:
- Promote a culture where data informs decisions
- Encourage the use of BI tools across all teams
- Provide practical learning tips and training for data analysis and visualization
By leveraging advanced analytics tools and techniques, companies can uncover hidden patterns, trends, and correlations, leading to more informed and strategic decision-making.
Adopting a culture of data-driven decision-making ensures that every choice is backed by evidence and analysis, rather than gut feelings or assumptions. This cultural shift not only enhances the decision-making process but also fosters an environment where continuous learning and improvement are valued.
Leadership in Data-Driven Organizational Culture
In the realm of digital transformation, the success of a data-driven culture is often attributed to the quality of its leadership. Leaders are the torchbearers of change, setting the example for others to follow. They must embody the principles of data-driven decision-making, demonstrating its value through their actions and strategies.
By fostering an environment where data is the cornerstone of every decision, leaders can cultivate a culture that embraces analytics as a critical tool for innovation and efficiency.
To truly embed a data-driven mindset within an organization, leaders must:
- Encourage the use of BI tools across all levels
- Provide necessary training for data interpretation
- Align data initiatives with business goals
Leaders must also be proficient in change management, guiding their teams through the adoption of new data practices and ensuring that these practices are integrated with the organization's strategic objectives.
Key Responsibilities and Skills of a BI Manager
A Business Intelligence (BI) Manager plays a pivotal role in bridging the gap between data and strategic decision-making. They are responsible for steering the BI strategy, ensuring it aligns with the organization's objectives and delivers actionable insights. A BI Manager must possess a blend of technical skills and business acumen, with an emphasis on leadership and communication to effectively manage a team of analysts and foster a data-driven culture.
Leadership is a critical skill for a BI Manager, as they must inspire their team to embrace BI tools and methodologies. They should also be adept at project management, overseeing the implementation of BI solutions from inception to completion. Training and development of staff is another key responsibility, ensuring that all team members are proficient in using BI tools and interpreting data.
A BI Manager must continuously monitor and adjust the BI strategy to keep pace with the evolving business landscape, making sure it remains relevant and effective.
The following table outlines some of the core skills and responsibilities of a BI Manager:
| Core Skills | Responsibilities |
|---|---|
| Data Analysis | Define BI objectives |
| Technical Proficiency | Implement BI solutions |
| Project Management | Monitor and adjust BI strategy |
| Communication | Cultivate a data-driven culture |
| Leadership | Train and develop staff |
Big Data Analytics: Unlocking Competitive Advantage

Harnessing Big Data for Business Innovation
In the realm of business, big data is the cornerstone of innovation. It provides an unprecedented depth of understanding into customer behavior, preferences, and market trends. By analyzing vast datasets, companies can uncover patterns and correlations that lead to groundbreaking products and services, operational enhancements, and strategic pivots that keep them ahead of the competition.
Big data analytics is not just about processing large volumes of information; it's about extracting actionable insights that drive business growth. The following list outlines the key steps organizations can take to harness the power of big data for innovation:
- Identifying the right data sources and ensuring access to high-quality data.
- Implementing robust data management and analytics infrastructure.
- Utilizing advanced analytics techniques, such as machine learning, to predict market changes.
- Continuously adapting strategies based on data-driven insights to maintain a competitive edge.
By embracing big data analytics, businesses are empowered to anticipate market dynamics and innovate proactively, ensuring long-term success and agility in a data-centric world.
Navigating the Landscape of Big Data Tools and Techniques
In the realm of big data, the selection of appropriate tools and techniques is critical for extracting valuable insights. Big data analytics is the cornerstone of this process, involving the extraction of meaningful insights from large and intricate data sets through diverse techniques and tools. These insights serve various purposes, from identifying patterns and predicting trends to optimizing processes and informing data-driven decisions.
Emerging trends in big data and predictive analytics are reshaping the way organizations approach data analysis. To stay ahead, businesses must adapt to these trends by selecting the right tools that align with their strategic goals.
- Track progress regularly to monitor project milestones and identify areas for improvement.
- Develop a data governance framework to ensure data accuracy, consistency, and compliance with regulations.
With the right strategies and tools, organizations can extract valuable insights from vast data sets, enhancing decision-making processes, boosting productivity, and positioning themselves as industry leaders.
Achieving a Competitive Edge through Data Insights
In the realm of business, gaining a competitive edge often hinges on the ability to analyze and interpret data effectively. By analyzing historical data and leveraging predictive analytics, companies can foresee potential risks and implement strategies to mitigate them before they impact the business.
- Identify market trends
- Optimize operational efficiency
- Personalize customer experiences
- Innovate products and services
These actions, rooted in data insights, enable businesses to not only react to market changes but also to anticipate and shape them. Furthermore, fostering a data-driven culture is crucial for sustaining innovation and agility in a dynamic market landscape.
By embracing big data analytics, organizations can transform raw data into strategic assets, driving decision-making and securing their position as industry leaders.
Building a Career in Business Analytics
Essential Skills for Aspiring Data Analysts
As the field of business analytics continues to grow, the demand for skilled data analysts is on the rise. Mastering the use of Tableau is a fundamental skill for those starting in this career. An entry-level Tableau Analyst should be proficient in creating basic charts and graphs, as well as in data preparation and cleaning. These skills are the bedrock for transforming raw data into actionable insights.
To excel as a Tableau Analyst, one must develop a robust set of skills:
- Understanding of Tableau's interface and tools
- Ability to create basic visualizations
- Knowledge of data preparation and cleaning techniques
- Analytical thinking and pattern recognition
- Proficiency in SQL for data manipulation
Advanced analytics, such as predictive modeling and machine learning integration, are becoming increasingly important. Familiarity with programming languages like Python or R can significantly enhance an analyst's capability to handle sophisticated analyses. Moreover, soft skills such as storytelling with data and effective communication are indispensable for conveying complex insights in an understandable manner.
To build a successful career in business analytics, it is crucial to engage stakeholders with compelling data stories. This involves identifying the right questions, collecting relevant data, applying appropriate models, interpreting results, and communicating findings clearly. A data-driven strategy is not just a tool but a core component of gaining a competitive edge and achieving digital transformation.
The Path to Becoming a Tableau Data Analyst
Embarking on the journey to become a Tableau Data Analyst is an exciting venture for those with a passion for data and storytelling. The first step is to gain a solid understanding of data visualization principles and the core functionalities of Tableau software.
Essential skills for a Tableau Analyst include technical proficiency in Tableau, analytical thinking, and the ability to craft a narrative from data. As analysts progress in their careers, they should focus on integrating complex data analysis and developing strategic insights.
To remain competitive, adopting an upskill/improvement mentality is crucial. The landscape of data is constantly evolving, and so should your skillset.
Here are some steps to guide you on this path:
- Master the basics of data visualization and Tableau.
- Obtain relevant certifications to validate your expertise.
- Gain practical experience through projects or internships.
- Engage with the Tableau community for continuous learning and networking.
- Transition to more advanced roles by focusing on strategic insights and mentorship.
Career Growth and Opportunities in Business Analytics
The landscape of business analytics is dynamic, with a spectrum of career paths that cater to a variety of interests and skills. The demand for professionals skilled in data science and business analytics is soaring, as industries increasingly rely on data-driven insights for strategic decision-making.
Career progression in this field often follows a trajectory from roles such as Data Analyst and Business Intelligence Analyst, to more senior positions like Data Architect or even Chief Data Officer. The journey is marked by continuous learning and adapting to new tools and methodologies.
The versatility of skills acquired through business analytics can open doors to numerous sectors, including technology, finance, healthcare, and more.
For those considering a transition or advancement within the field, here are some potential career paths:
- Data Analyst: Unlocking business insights through data, driving strategic decisions with numbers.
- Business Intelligence Analyst: Transforming data into insights, driving strategic business decisions and growth.
- Data Architect: Designing robust data systems that serve as the backbone for analytics.
- Tableau Analyst: Specializing in data visualization to communicate complex data clearly.
With the right education and experience, a career in business analytics can be both rewarding and secure, offering opportunities to solve complex business problems and drive innovation.
Future Trends in Business Analytics and Big Data
Emerging Technologies Shaping the Analytics Landscape
The landscape of business analytics is continually evolving, with emerging technologies playing a pivotal role. Data democratization is a key trend, enabling non-technical users to engage with data analytics more easily than ever before. This shift is driving organizations to prioritize data quality and governance, ensuring that strategic decision-making is supported by reliable and governed data.
Another significant development is the integration of advanced analytics into everyday business processes. Predictive analytics, for instance, is not just a buzzword but a reality that is enhancing the foresight of businesses. Companies are now able to anticipate market trends, customer behaviors, and potential risks with greater accuracy, leading to more informed and proactive strategies.
The synergy between big data analytics and innovative strategies is creating unprecedented opportunities for businesses to gain insights and drive growth.
While the benefits are clear, challenges such as privacy concerns, security, and potential biases in decision-making must be navigated carefully. Addressing these issues is essential for maintaining trust and ethical standards in the use of big data analytics.
Adapting to Continuous Innovation in Data Analytics
In the realm of business analytics, continuous innovation is not just a buzzword; it's a survival strategy. As the landscape of data analytics evolves, so must the strategies and tools that businesses employ. The integration of cutting-edge technologies into predictive analytics is a testament to the field's dynamic nature, promising a future rich with advancements.
- Continuous Learning: Analysts must engage in lifelong learning to keep pace with technological advancements.
- Adaptability: Embracing change and adapting strategies are crucial for leveraging new opportunities.
- Data-Driven Culture: Implementing a culture that prioritizes data in decision-making processes enhances innovation and operational efficiency.
By fostering a culture of continuous learning and adaptability, organizations can ensure they remain at the forefront of their industries. This proactive approach is essential for harnessing the full potential of big data analytics and maintaining a competitive edge.
Predictions for the Next Wave of Business Analytics
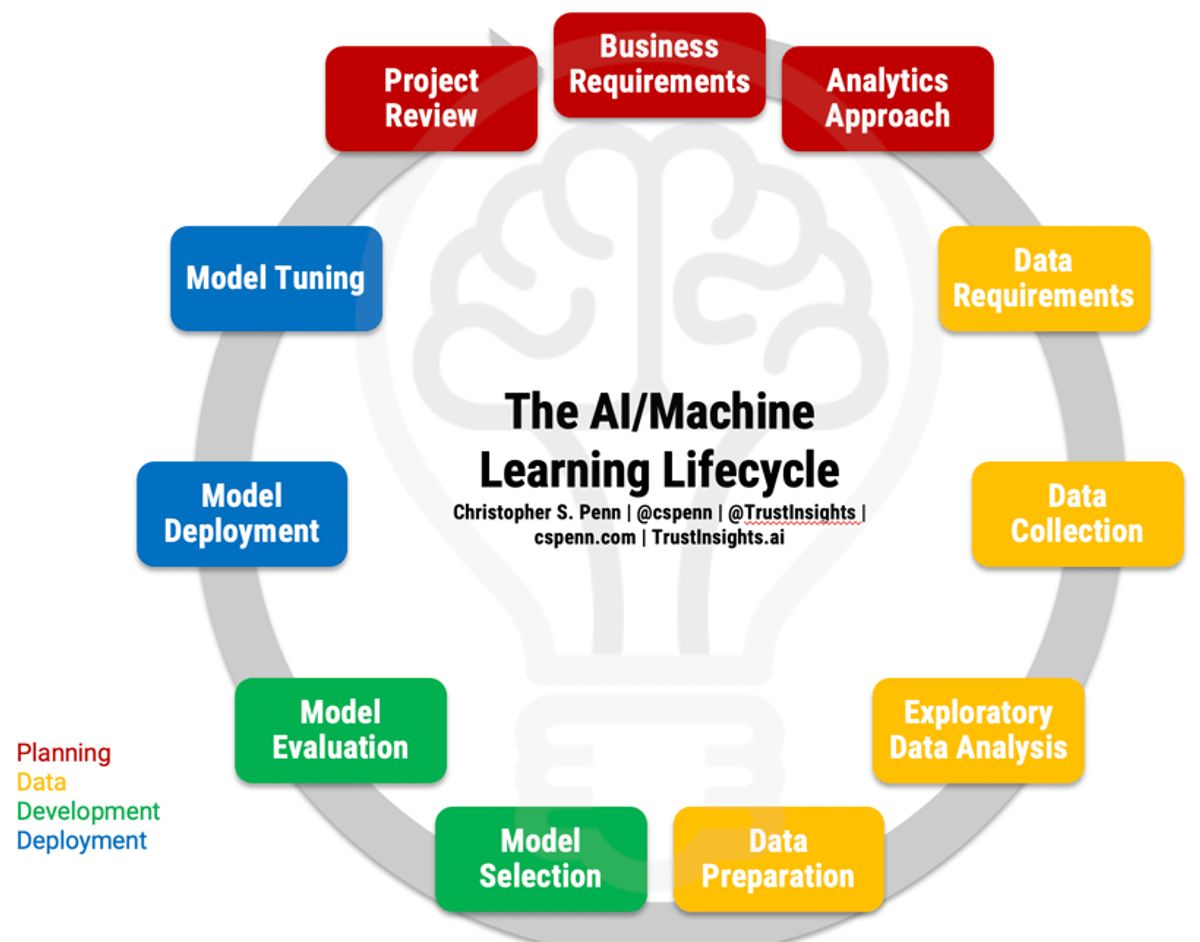
As we look towards the future, the landscape of business analytics is poised for transformative changes. The integration of machine learning (ML) into business analytics is expected to follow a more structured approach, with a focus on identifying problems, cleaning data, training models, evaluating performance, and deploying them to glean insights. This progression will enhance the forecasting capabilities of businesses, allowing for more accurate predictions and strategic planning.
The evolution of predictive analytics will be marked by a significant shift towards more sophisticated and nuanced models, capable of handling the complexities of big data.
Emerging trends in big data and predictive analytics are set to redefine how organizations approach decision-making. A key trend is the utilization of artificial intelligence (AI) to improve operational efficiencies and decision-making processes. By analyzing historical sales data and relevant factors, companies can forecast sales volume and future sales trends with greater precision. This enables businesses to optimize inventory management and tailor marketing strategies to meet market demand.
The table below outlines some of the key trends in data analytics that are expected to gain traction:
| Trend | Description |
|---|---|
| Advanced Statistical Modeling | Enhanced techniques for deeper insights. |
| Data Mining | Extracting patterns from large datasets. |
| AI Optimization | Streamlining processes and decision-making. |
As these trends converge, the next wave of business analytics will unlock new levels of competitive advantage and innovation.
As the digital landscape evolves, staying ahead in the realm of business analytics and big data is crucial for any enterprise aiming to thrive. At OptimizDBA, we specialize in propelling your data management to the next level with faster data solutions and unparalleled database optimization consulting. Our commitment to excellence is echoed by our clients, like Stella Budrean from Radio-Canada Inc., who experienced the transformative impact of our expertise. Don't let your business fall behind; visit our website to discover how we can accelerate your transaction speeds and guarantee a significant performance increase. Let's navigate the future of data together!
Conclusion
In the journey from raw data to strategic insights, business analytics emerges as a critical discipline that empowers organizations to navigate the complexities of big data. By harnessing the power of business intelligence and advanced analytics, companies can uncover patterns, predict trends, and make data-driven decisions that drive innovation and competitive advantage. As we have explored, the art of mastering business analytics involves a blend of technical skills, strategic thinking, and continuous learning. The future belongs to those who can effectively transform data into actionable insights, ensuring that their decisions are informed, their operations optimized, and their market position strengthened. The transformative potential of business analytics is not just a competitive edge—it is a cornerstone for success in our data-centric world.
Frequently Asked Questions
What is the role of Business Intelligence (BI) in data analytics?
Business Intelligence (BI) plays a crucial role in data analytics by providing the tools and techniques necessary to transform raw data into meaningful insights. It helps in understanding historical and current data, which supports decision-making and strategic planning.
How does BI differ from Business Analytics?
BI focuses on extracting insights from historical and current data, while Business Analytics goes further by using advanced statistical modeling, data mining, and AI to predict future trends and optimize processes.
What are some key BI tools and technologies?
Key BI tools and technologies include data extraction and transformation tools, data visualization software like Tableau, and statistical analysis platforms that facilitate the analysis and interpretation of data.
What challenges might one face in data analysis?
Common challenges in data analysis include managing large volumes of data, ensuring data quality and integrity, overcoming technical and resource constraints, and extracting actionable insights from complex datasets.
Why is data visualization important in business analytics?
Data visualization is important because it transforms complex data into visual stories that are easier to understand and interpret, which aids in insightful decision-making and effectively communicates findings to stakeholders.
How can predictive modeling impact business decisions?
Predictive modeling can significantly impact business decisions by forecasting future outcomes, identifying trends and patterns, and enabling businesses to anticipate changes and make proactive, data-driven decisions.
What is the strategic role of a Business Intelligence Manager?
A Business Intelligence Manager bridges the gap between data and decision-making, leads data-driven organizational culture, and is responsible for managing BI tools and strategies to transform data into actionable business insights.
How does big data analytics provide a competitive advantage?
Big data analytics provides a competitive advantage by allowing organizations to harness vast datasets for innovation, optimize processes, and extract valuable insights that inform strategic decisions and position them as industry leaders.